Claude Code felt slow. So I X-rayed a month of my own logs.
Hitesh Jain · 2026-05-22
I broke a month of my own Claude Code logs into tokens, time, and cost. The surprise: you don't pay to generate, you pay to re-read — the same context re-sent every turn turns ~29M unique tokens into 4.35B billed, and the hidden reasoning I never see is the biggest line on both sides (84% of output, ~60% of re-read). Here's the full breakdown, plus the Python to run on your own logs.
Just want to run it? Reads only your local ~/.claude logs → github.com/Coral-Bricks-AI/coral-ai/claude-code-token-xray.
It started in Cursor. I was running Opus there on API pricing, and when the 4.7 upgrade landed, everything felt slower.
Also, my token consumption had quadrupled on the same kind of work I'd been doing on the previous Opus (chart below).
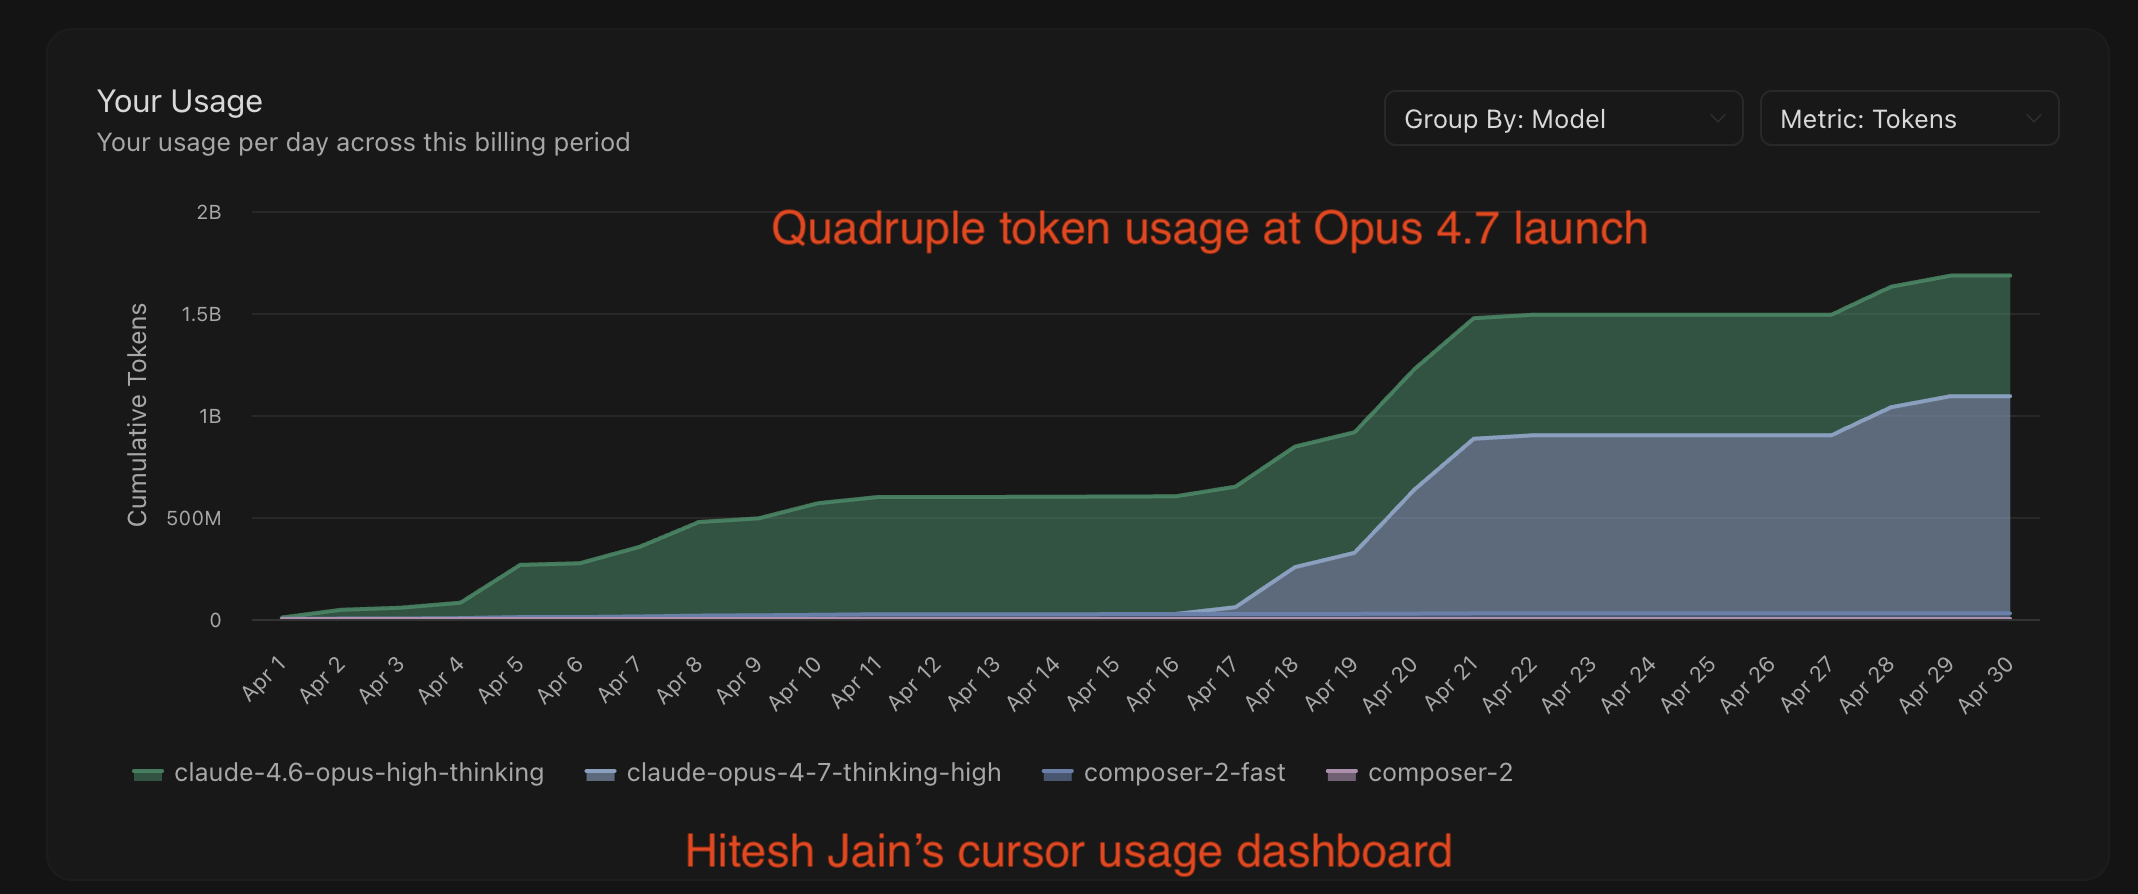
At API pricing that's a steep jump in spend, so I moved to a Claude Code subscription to get off metered billing. (Why it jumped turned out to be the most interesting part — I get to it further down.)
And it still felt slow — same model underneath, same lag before anything happened. Claude Code leaves the whole story on disk: every session is logged as JSONL under ~/.claude/projects/. So I parsed a month of mine: 181 sessions, 25,564 model calls, April 21 to May 21.
Where the tokens and the time go
Across the month, ~61h of active machine time. I split it two ways: what the model wrote (generated once, billed at output rates) and what it read (re-read on every turn, billed at input rates) — the second is where the cost lies.
Output — what the model wrote, once (20.4M tokens, 41h 28m of generation):
| Activity |
Tokens |
Time |
| Reasoning (hidden thinking) |
17.3M (84%) |
35h 05m (57%) |
| Writing tool calls |
2.3M (11%) |
4h 42m (8%) |
| Writing summaries |
0.8M (4%) |
1h 41m (3%) |
| Total |
20.4M |
41h 28m (68%) |
Input — what it reads, every turn. Unique = the distinct tokens; Total = what's actually billed, since each of ~25K calls re-reads the whole ~173K-token context. Time is wall-clock spent producing that input (running commands, searches); the re-read itself carries no separate clock — the cached context is served from a pre-filled KV cache the logs give no visibility into, so any read time is folded into generation, above:
| Activity |
Unique |
Total re-read |
Time |
| Reasoning (hidden thinking) |
17.3M |
2.6B (60%) |
— |
| Reading / searching / web |
2.7M |
0.50B (11%) |
34m (1%) |
| Writing tool calls |
2.3M |
0.42B (10%) |
— |
| Running commands (Bash) |
2.2M |
0.33B (8%) |
14h 30m (24%) |
| System prompt + tools + config |
1.9M |
0.20B (5%) |
— |
| Pasted attachments |
1.0M |
0.13B (3%) |
— |
| Writing summaries |
0.8M |
0.11B (2%) |
— |
| The instruction I typed |
0.3M |
0.02B (0.5%) |
— |
| Subagents & background jobs |
0.2M |
0.02B (0.5%) |
4h 42m (8%) |
| Injected reminders |
0.2M |
0.01B (0.3%) |
— |
| Editing files |
0.08M |
0.01B (0.3%) |
7m (0.2%) |
| Total |
~29M |
4.35B |
19h 53m (32%) |
The tables overlap on purpose — what the model writes becomes context it re-reads — so ~29M unique tokens balloon to 4.35B billed (~150×), and reasoning is 60% of everything re-read, not just 84% of output. Method: tokens are tiktoken estimates (±15%; billed dollars exact); reasoning is recovered by subtraction (Claude never logs it); time from event timestamps; the per-line re-read split is modeled — replayed per session, scaled to the measured 4.35B.
A few things stand out:
- Reasoning dominates both sides — 84% of what the model writes, and ~60% of what it re-reads (2.6B of 4.35B input tokens).
- A quarter of the wait isn't the model at all — 14h 30m (24% of the clock) was Bash commands actually running (real execution time — auto-approved, so no approval wait; background runs aren't counted). So the slowness I felt is really two things: the model thinking (57%) and commands executing (24%). The parts I'd have blamed — reading files, editing — are minutes.
- The visible work is a rounding error — everything I typed all month was 0.3M tokens (~0.5% of the re-read bill), and editing files took 7 minutes total. The system prompt, tool schemas Claude Code prepends to every call and reasoning outweigh my entire month of input.
That 4.35B re-read is the whole ballgame. The next section turns it into dollars.
Why it's expensive: the context is re-read every turn
I'm on a Claude Max subscription ($200/mo) now, so I don't see a per-token bill. But the usage is real compute, and at Opus 4.7 API rates my month would have run $3,371 — significant if you're building custom apps.
| Line item |
Cost |
Share |
| Input — re-reading context (cache reads) |
$2,176 |
64% |
| Input — cache writes |
$682 |
20% |
| Input — fresh (uncached) |
$2 |
0% |
| Output — reasoning |
$429 |
13% |
| Output — tool calls |
$61 |
2% |
| Output — summaries |
$21 |
1% |
| Total |
$3,371 |
100% |
The bill is 84% input, 16% output — and within input, 64% is the model re-reading the same context every turn. Each call re-sends the whole growing input (mine averaged 173K tokens, 98% served from cache), so every token that goes into context gets paid for again on every turn. Caching is the only thing keeping it sane — without it the same work lists at $22,630, ~7× more. On the output side, even the generation is mostly reasoning ($429); the summaries it writes cost $21.
And every reasoning token is charged at least three times: once to generate it, once to write it to cache, then again on every turn it's re-read for the rest of the session — and the re-reads, not the thinking, are what pile up.
What this means if you're building on agents
Claude Code runs two opposing workload shapes:
|
Main thread (reasoning-bound) |
Subagents (data-bound) |
| Model |
Opus 4.7 |
Haiku 4.5 (mostly) |
| Context / turn |
173K |
61K |
| Input served from cache |
98% |
93% |
| LLM turns / agent |
140 |
38 |
| Reasoning, % of output |
84% |
35% |
The main thread — me coding — thinks far more than it reads. Its subagents (Explore, code and docs search) are the mirror image: a cheap model dragging files into context to hand back a tiny answer. One thinks; the other reads.
Either way, both shapes have the same problem — re-reading context every turn. And this was one person at a keyboard; build a custom app on API pricing and the bill scales with turns × fan-out × context × users — and it bends the wrong way as you grow: the more capable your agents and the more people using them, the more you re-pay to re-read. The first lever you'd reach for is the wrong one: a cheaper model or a shorter prompt barely dents it. And the prefix cache is already near-saturated — 98% of the main thread's input served from cache, 93% of the subagents' — yet re-reading is still 64% of the bill.
The real lever is curating what stays in context — and, for the data that doesn't change, not re-reading it at all.
A note on adaptive thinking (the 4.6 → 4.7 story)
Claude's thinking is adaptive — no fixed budget; the model decides how hard each step is. Mine: median 392 tokens/turn, mean 805, max 22,137 — a heavy right tail where most turns barely think and a few think enormously. On the same work, 4.7 didn't get pricier per token; it just chose to think more — and that's what quadrupled my token consumption.
And that bites. I never see the thinking, and I saw no sign 4.7 answered better than 4.6 — only that it thought more, ran longer (57% of my clock), and cost more. At Cursor's API pricing that was enough to move me onto a subscription. Intended or not, the same invisible dial turned a paying API user into a subscriber.
Takeaways
- You pay to re-read, not to generate. 84% of the bill is input — processing context, not producing answers — and the biggest slice of that is the same context re-read every turn (29M unique tokens billed as 4.35B). The only real fix is to stop re-reading what doesn't change or matter for the next turn.
- Two shapes, one bill. Agents run in two opposite shapes: a main thread that thinks far more than it reads, and cheap subagents that read far more than they think. Opposite workloads, identical problem: both re-read their whole context every turn, and that's what runs up the bill.
- The biggest single line is the one you never see. Hidden reasoning is 84% of what the model writes and ~60% of everything it re-reads — the largest cost on both sides, invisible to you. And unlike context, you can't curate it: the model alone decides how hard to think, turn by turn.
This is one month, one person — yours will look different. Run it on your own ~/.claude logs: the scripts (tokens, time, cost, and the main-vs-subagent split) are open source and read local logs only, so nothing leaves your machine. Clone it, run it, and ⭐ it if it's useful → github.com/Coral-Bricks-AI/coral-ai/claude-code-token-xray.
I went in chasing a slow tool; I came out with the operating cost of running agents, and it bends the wrong way as you grow. The slow part is the thinking, and there's no fixing that. The expensive part is the re-reading: the same context, every turn. That part you can fix.
That's why we are building Coral Bricks: agents over your own data, without re-paying to re-read what doesn't change. I'm Hitesh; if that's your world, let's compare notes.
Thanks to my co-founder Divy Vasal and Kenny Daniel (Founder, HyperParam) for the review — the only reasoning that went into this post at zero tokens and $0.